
I make money on YouTube. It’s not millions or anything, but it’s a steady and increasing stream of monthly income, much of which is passive.
Yet, I have never recorded myself, I’ve never talked in front of a camera or in an audio clip, and I have only very basic editing skills.
Let me tell you how I use a free tool to create a form of videos that haven’t been used all over YouTube and present a million and one opportunities for building your own faceless channel and earning money with it.
Overview
If you read my previous stories about YouTube, you’re already familiar with the free tool I’m talking about here.
It’s called Flourish, you’ll find the website under flourish.studio.
A cool side note: Flourish is now part of Canva. That means you can easily import flourish data into Canva. There will be even more interaction between the two services soon too, I’m sure.
Flourish is quite unique because it offers a wide range of data visualization formats to use in slides, presentations, or videos.
I love this tool, because a) it’s free and b) the possibilities for creating unique content are endless.
How I use the tool
Famously on YouTube, this tool (and similar tools) has been used to create bar chart races. You might have seen those. They’re all over YouTube and, to be honest, they’re not fun anymore (for me, at least). Here’s an example:
In contrast, the way I use the tool to create animated timelines hasn’t been explored much — if at all — on YouTube yet.
That’s fantastic because it means this niche is wide open and up for grabs. Not just for me, but for thousands of creators.
So, why am I not rich?
Honestly, over the past two years, I haven’t had the time to focus on that. It takes a little more effort to create these videos. I have a 9-to-5 job, 5 kids, Medium (which is going well at the moment), and a few other projects.
24 hours is not enough to fit YouTube in every day. A shame. This is hopefully going to change soon as I’ll be embarking on a full-time entrepreneurial journey from April on.
The magic formula: Line chart races
Let’s dive in. The data format I use to create animated timelines is called line chart race. In essence, this is a set of data points visualized by moving lines over a period of time.
To see an example of this format and my use of it, you can take a look at my video here (I have shared this a few times):
The technical aspect
Now, what does the backend of this video look like? I’ll show you. It’s not super complicated.
There are two tabs for the backend, one is the preview tab, the other is the data tab, see below.
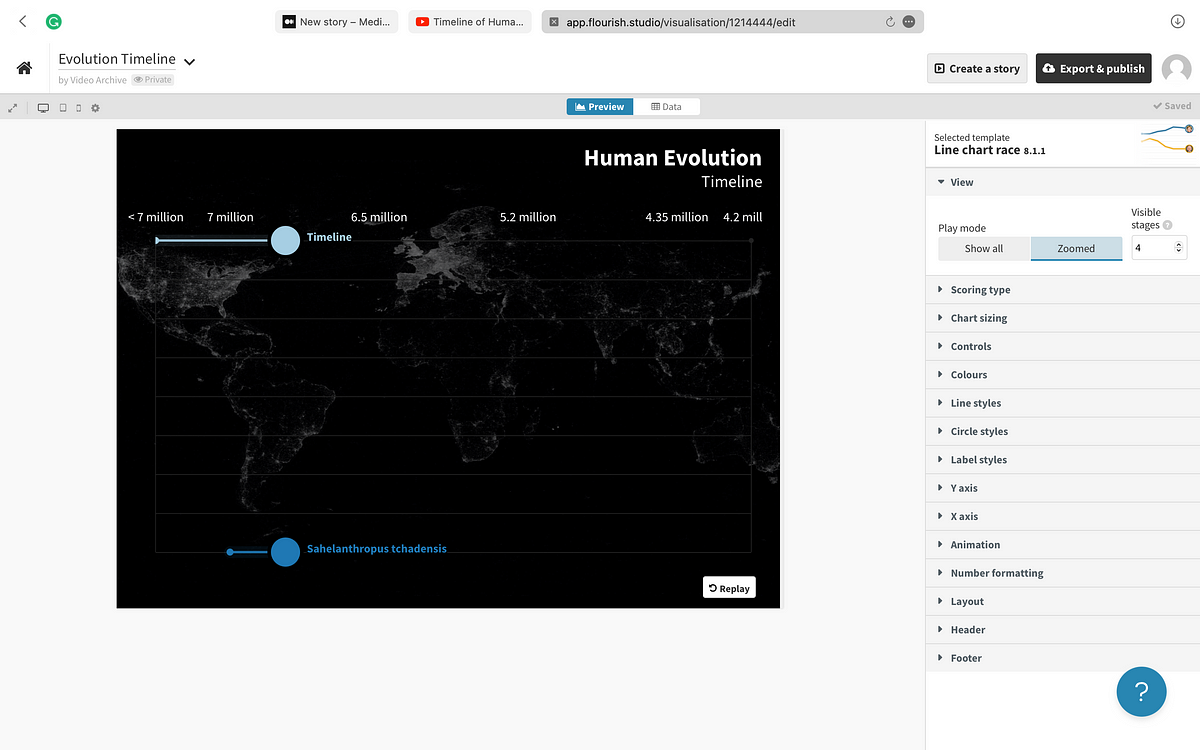
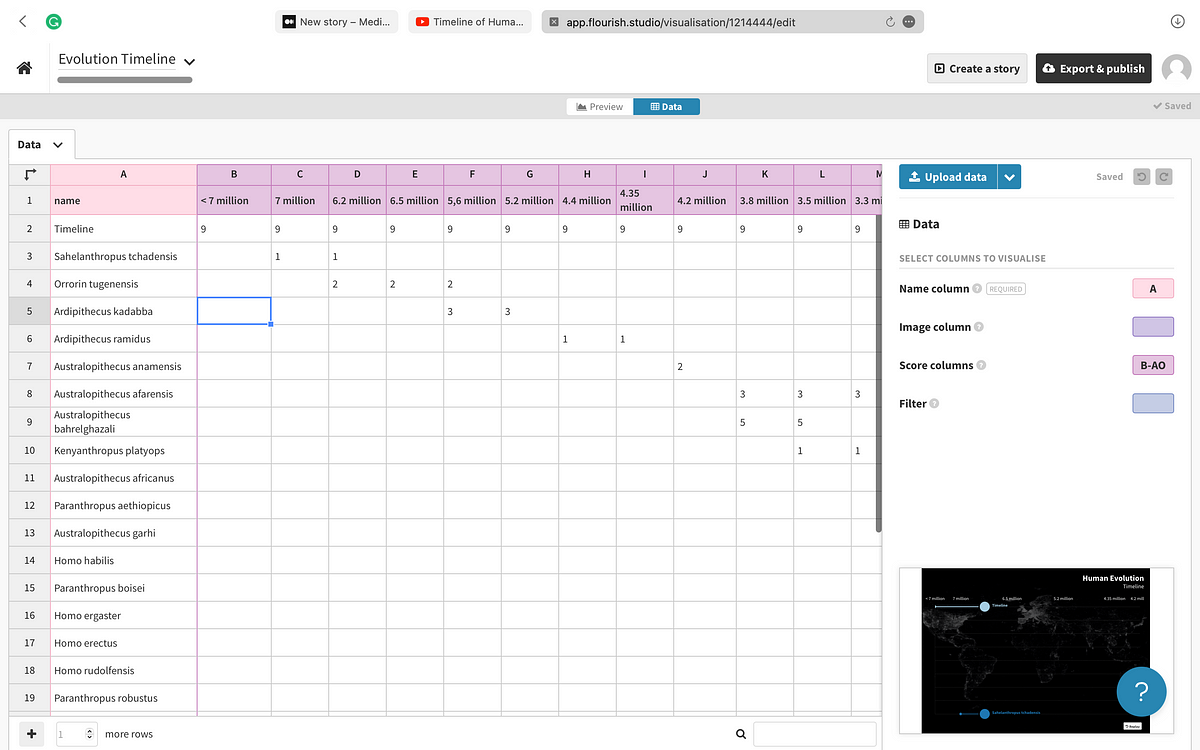
In the latter, you insert all data points, structured in columns and rows, as well as resources like images or captions.
In the former, you design the actual line chart race animation with colors, speed, controls, formatting, and more. Try it yourself to see what’s possible.
Where do you get the data? That depends. You either collect it yourself or you’ll find a free data source online. I do both.
The process of turning a line chart race into a video
Once you set up the data and design, you can replay the animation in the preview tab.
Now, the free version of Flourish doesn’t allow you to export the finished project in any form other than as a .csv file.
How can you make a video then?
A little workaround: Just record your screen while you replay the video. This can be done on any PC with either built-in tools or added free software. Use full-screen mode for that.
Afterward, you might need to crop the video a little to get rid of the browser bar, etc., then you can import it into your video editing software of choice — I use the free Apple tool iMovie for this — then you add music and maybe some captions, text or images… and you’re done.
Upload it to YouTube and you’re good to go.
The bottom line
With the simple, yet powerful tool Flourish and a basic video editing software, you can create a plethora of data visualizations in a relatively short period of time and turn them into YouTube videos without ever having to be in front of the camera, talk into a mic, or pay for tools upfront.
You can even do that on an iPad, for example, given the tool is a web app. A phone might be too small.
The challenge?
The challenge now is coming up with interesting ideas for timelines and data structures.
Here are a couple of ideas:
- create timelines of historic events and how they relate to each other or overlap in time. I tried that with war timelines.
- create timelines about your favorite movies or TV shows and where they sit in time, related to each other
- evolution is a good topic, just like the video above or this one.
I’m sure you’ll come up with some crazy awesome ideas to make use of this tool. I have a lot to learn as well. I’m not a pro. Not remotely close.
Fellow Medium writer Carlyn Beccia already shared an idea with me after my previous post about this tool. She writes nonfiction books for kids and sees this format of line chart races as a promotion opportunity for a book.
The possibilities are truly endless. And the learning curve is very flat. Give it a try, you’ll be surprised!